グラフ・ギャラリー
グラフで模様を描いてみました。| グラフ | 使用した数式等 |
|---|---|
 | グラフの精密さ:1 y=sinx y=cosx y=tanx y=-tanx y=10 y=-10 |
 | グラフの精密さ:1 y=2sin(x/2) y=-2sin(x/2) y=cos(x/2) y=-cos(x/2) y= |
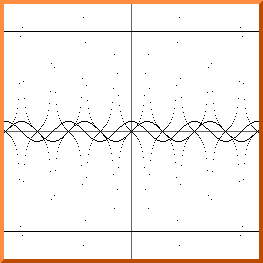
 | グラフの精密さ:1 y= |
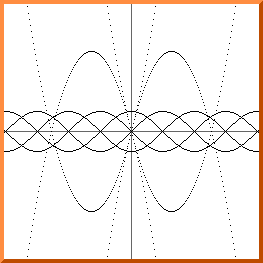
 | グラフの精密さ:1 y= |
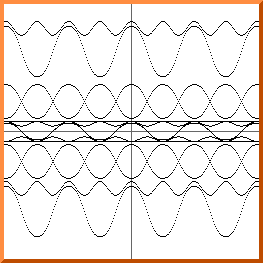
 | グラフの精密さ:1 y= |
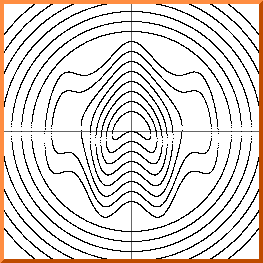 | グラフの精密さ:10 (円・楕円のグラフ) |
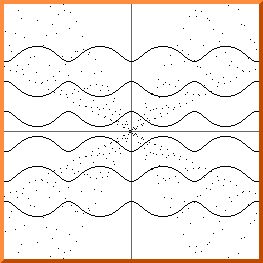
 | グラフの精密さ:40 y=(x-0)2/(100sinxx)2 + (y-0)2/(2cosxx)2(楕円のグラフ) グラフの精密さ:1 y=(x-|sinx|) y=(x+|sinx|) y=-(x-|sinx|) y=-(x+|sinx|) |
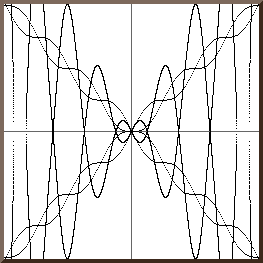
 | グラフの精密さ:1 グラフ縮小率:0.5 y=(<xx-sinx>+cosx) y=-(<xx-sinx>+cosx) y=x+(<xx-sinx>+cosx) y=x-(<xx-sinx>+cosx) y=-x+(<xx-sinx>+cosx) y=-x-(<xx-sinx>+cosx) |
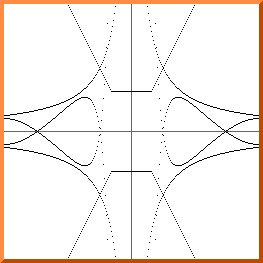
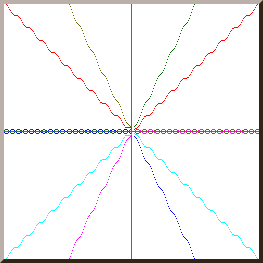
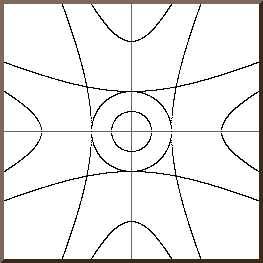 | グラフの精密さ:10 双曲線のグラフ(a=4,9, b=4,9 ±) 円のグラフ(r=2,4) |